Use the dAIEdge-VLab
To use the dAIEdge-VLab, make sure you have an account. If you don’t have an account yet, you can create one here.
dAIEdge-VLab Interface
The users access the dAIEdge-VLab through a web interface. The web interface provides a user-friendly environment to configure and run benchmarks, visualize results, and compare different models and targets.
Here is the url to access the dAIEdge-VLab : dAIEdge-VLab
Login
Press the login button in the top right corner of the page. Enter your credentials and press the login button. Once logged in, you will be redirected to the dAIEdge-VLab introduction page.
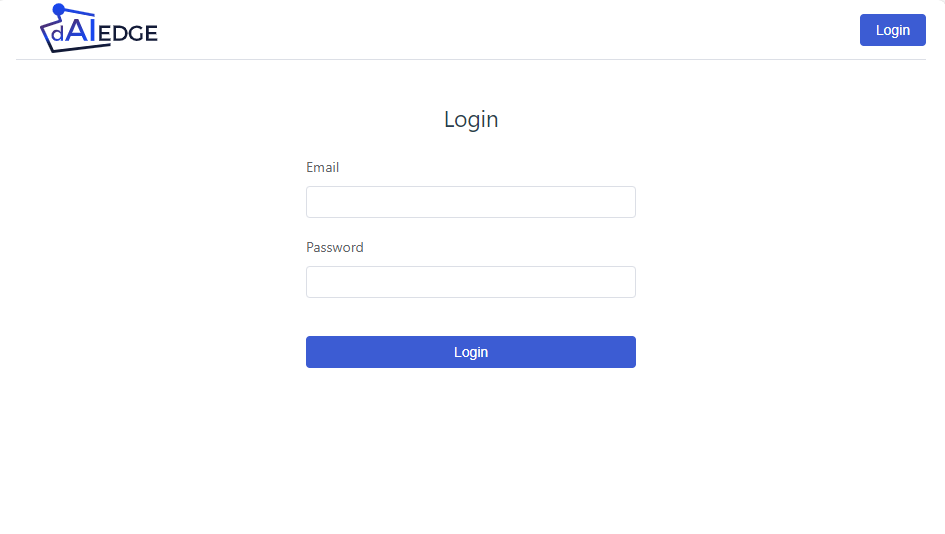
dAIEdge-VLab login page
Start a benchmark
To start a benchmark, press the “Start benchmarking” button in the introduction page. You will be redirected to the benchmark configuration page.
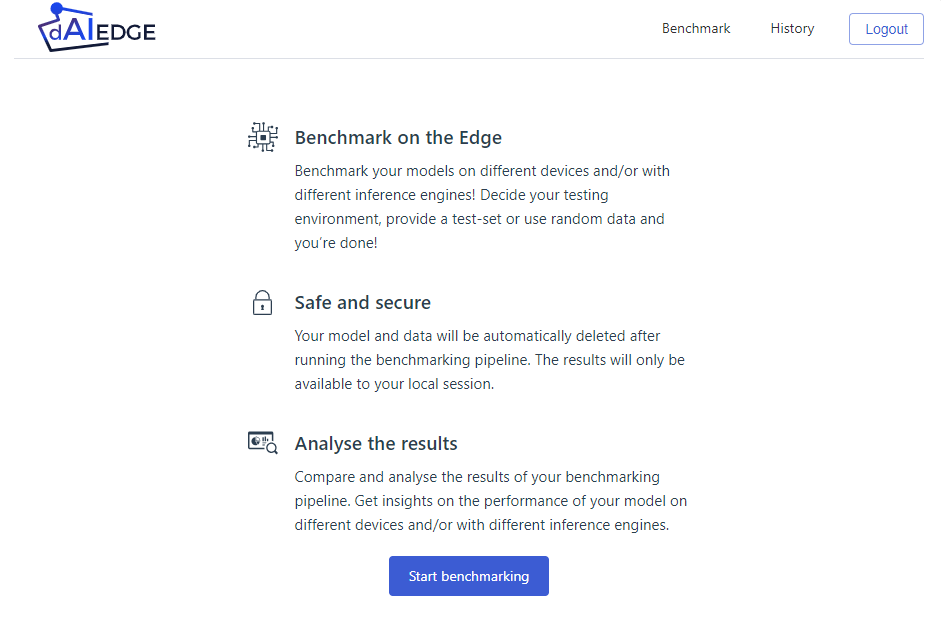
dAIEdge-VLab introdcution page
Benchmark configuration
The benchmark configuration page allows you to select the target on which the model will be deployed and benchmarked. You can also upload a pre-trained model and select the benchmarking parameters.
- Device field : Select the target on which the model will be deployed and benchmarked. You can type the name of the target in the field to filter the list of targets.
- Inference engine field : Select the inference engine that will be used to run the model on the target. Note that only the compatible inference engines with the target are displayed.
- Model field : Upload the pre-trained model that will be deployed on the target. The model must be compatible with the inference engine selected. Note that the model name sould not contain any spaces.
Press the “Launch benchmark” button to start the benchmark.
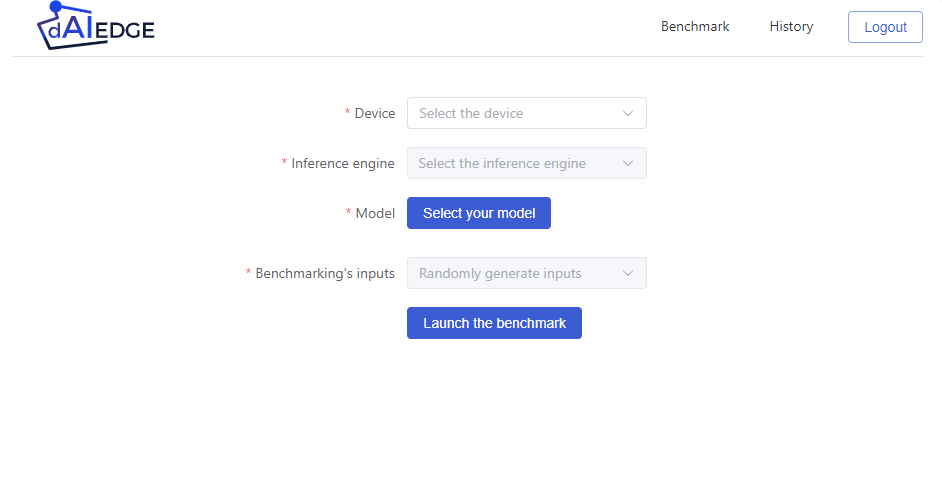
dAIEdge-VLab benchmark configuration page
Benchmark waiting page
Once the benchmark is launched, you will be redirected to the benchmark waiting page. This page displays the status of the benchmark. You can see the benchmark progress. Once the benchmark is completed, you will be redirected to the benchmark results page.
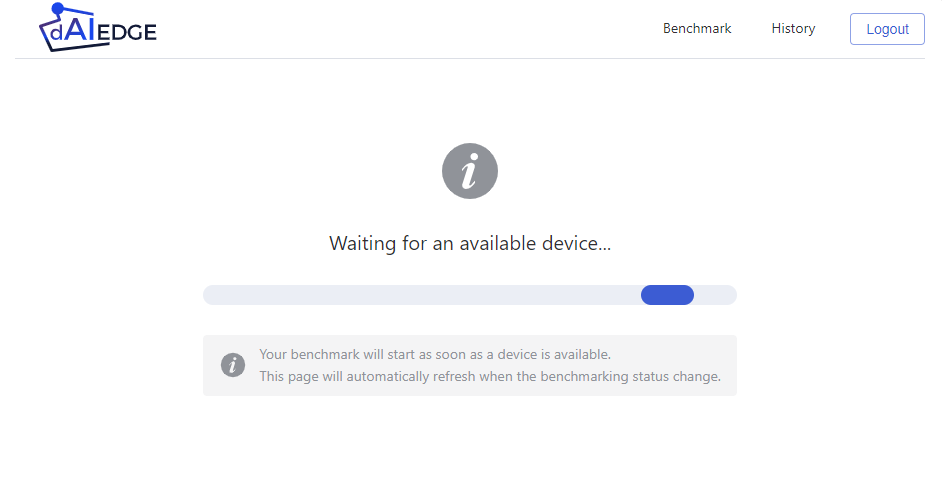
dAIEdge-VLab benchmark waiting page
Benchmark results page
The benchmark results page displays the results of the benchmark. You can see the inference time, the memory usage, and the CPU usage of the model on the target if available.
The histogram displays the inference time layer per layer. You can select specific layer you want to display.
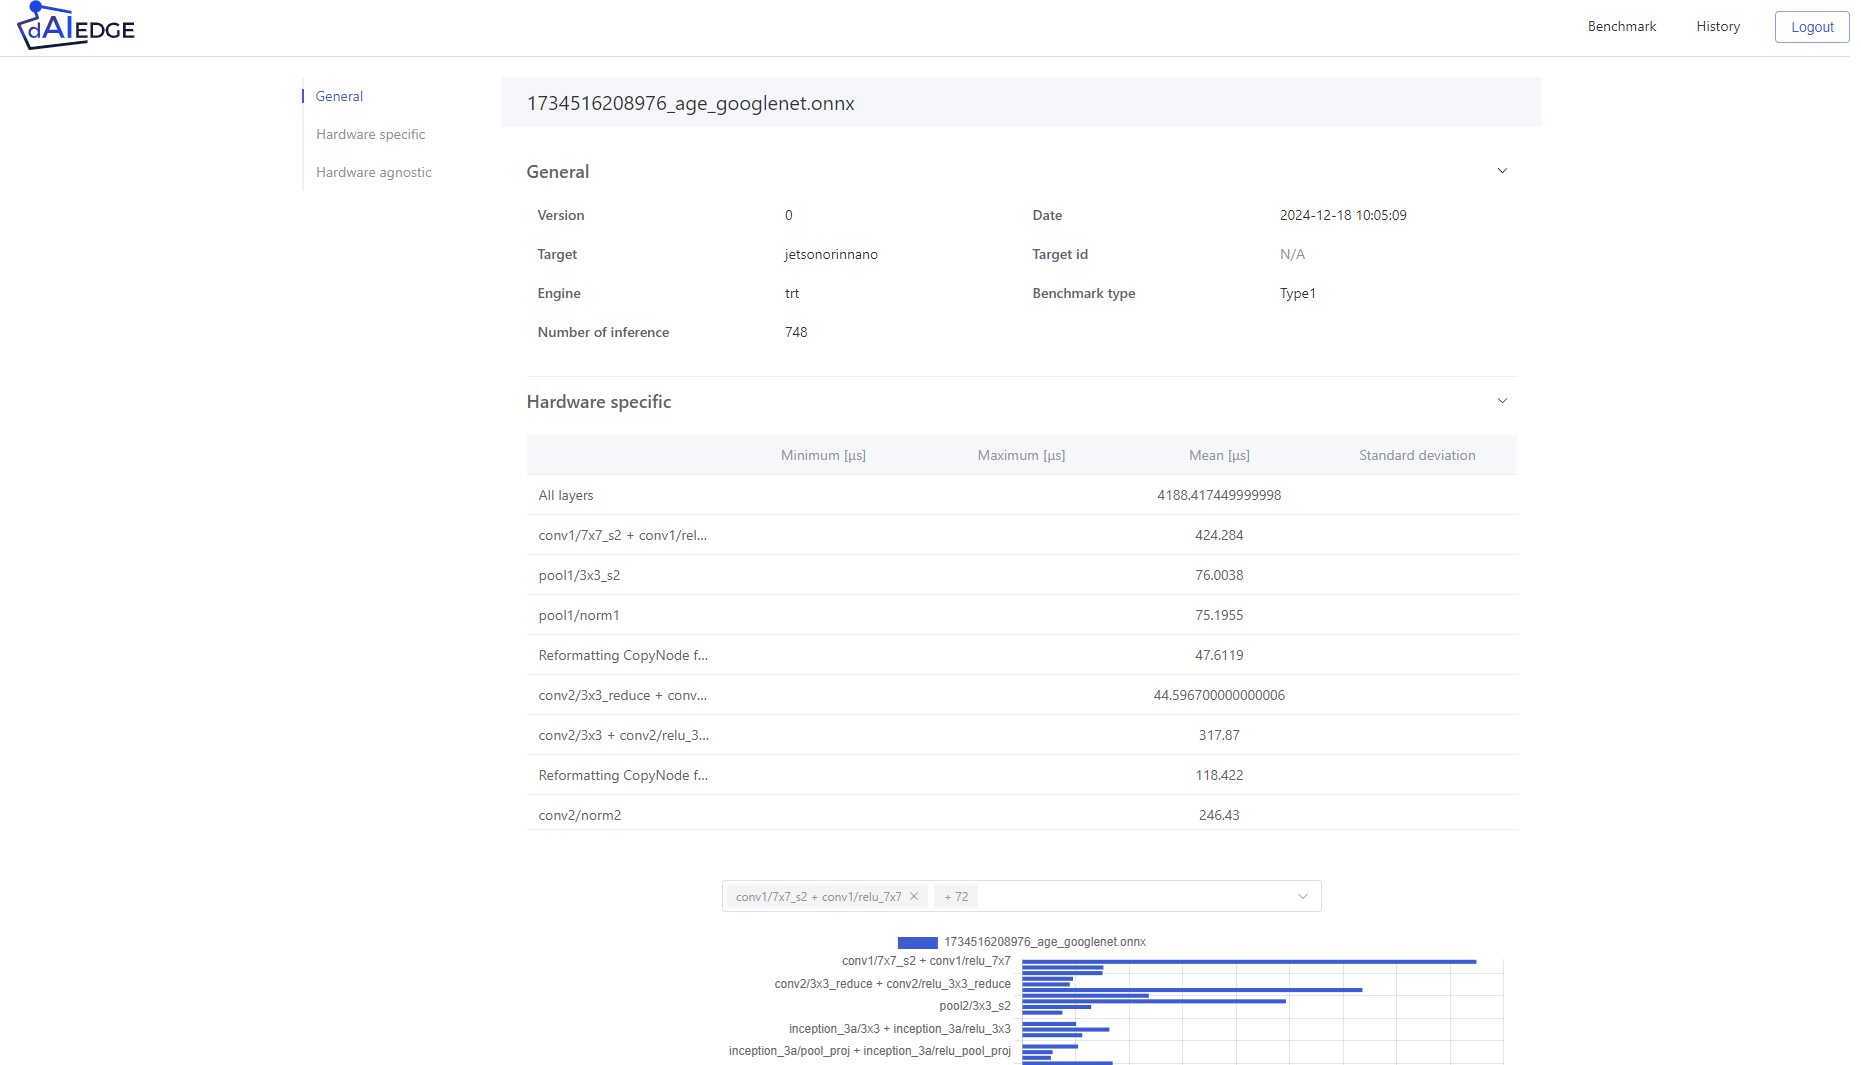
dAIEdge-VLab benchmark results page
History page
The history page displays the history of the benchmarks you have launched. You can see the status of the benchmark, the target, the model, and the inference engine used.
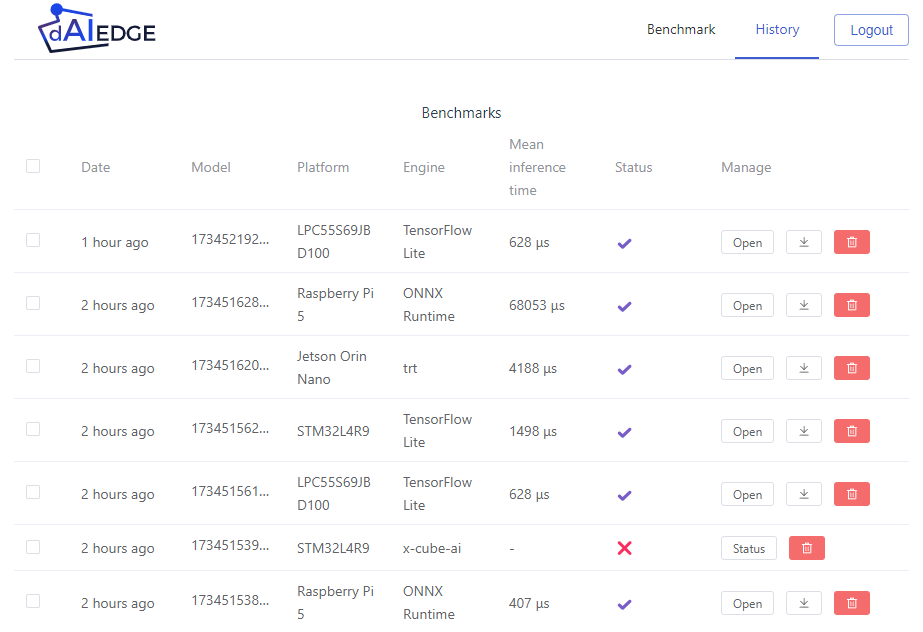
dAIEdge-VLab history page
Error page
The error page displays the error message if the benchmark failed. You can see the error message and the pipeline history if the target is in developpement mode.
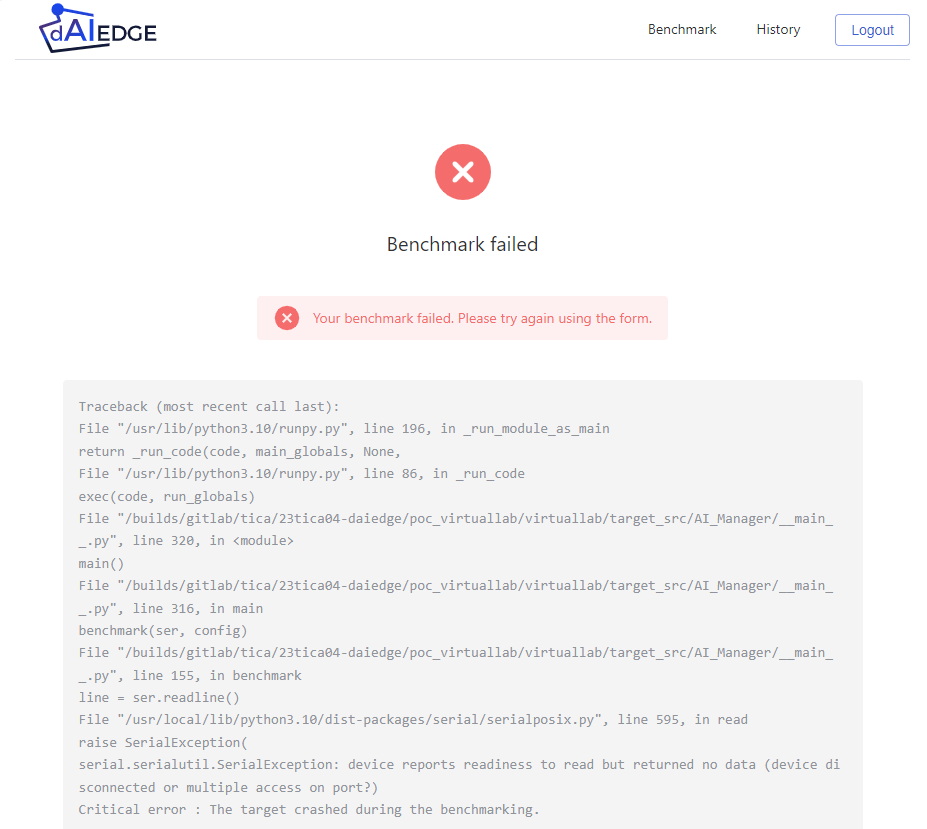
dAIEdge-VLab error page